Monday, June 20, 2005
Reb's Pitching Efficiency Index
I don't know if you all remember, but a couple weeks ago I mentioned I was working on a more quantified analysis of Red Sox pitching. I'm sure that this type of project is much better suited for people with high-powered computer programs and access to lots and lots of data... but I dug in anyway.
Naturally I could not be content to use one of the many readily available statistics to assess our pitching staff; none were quite what I wanted, so I had to make up my own. Now that I've spent hours and hours collecting data and transforming it into charts, I'm sure someone will inform me that this stat IS available and I've completely wasted my time.
Reb's pitching efficiency index is similar to both opponants' slugging average, and opponant's on base percentage. The formula is very simple:
bases awarded / batters faced = reb's PEI
I have a feeling not everyone is going to agree with how I came up with those numbers. That's ok; I don't expect this statistic to be particularly helpful to anybody... I made it up for myself, so I can better understand how I feel about the overall performance of our pitchers.
Batters faced is the easy one. This is listed at the bottem of the box score. Intentional walks are subtracted from the total batters faced.
Bases awarded is the just as it sounds. Base hits count for the number of bases gained from the hit, as in slugging. Also counted are walks, hit batsmen, balks, wild pitches, stolen bases, and errors charged to the pitcher. (exception: errors not resulting in a base awarded are not counted. example: Tim Wakefield was charged an error on 4/11 for dropping a foul ball.) Subtracted from this are pick-off plays, caught stealing & intentional walks. A couple people have objected to my using stolen bases in this stat, because the runner would be thrown out by the catcher. My feeling is that any MLB catcher is capable of making this throw, and the effect of the defensive players in this case is just as in any other ball in play. The speed at which the ball reaches the plate from the wind-up is the largest factor in stolen bases... why else would there be so many attempts on certain pitchers(i.e. Wakefield) and hardly any at all on others (i.e. Arroyo)? My feeling is that games do not happen in a vaccumn. Those bases count, however they were gotten. Some pitchers are lucky, stranding base-runners in every inning, others are unlucky, giving up all their hits in one inning. While there is something to be said for the ability to pitch under pressure, for the most part I believe these things even out over time. Therefore, I believe this is a realistic way to compare the effectiveness of pitchers.
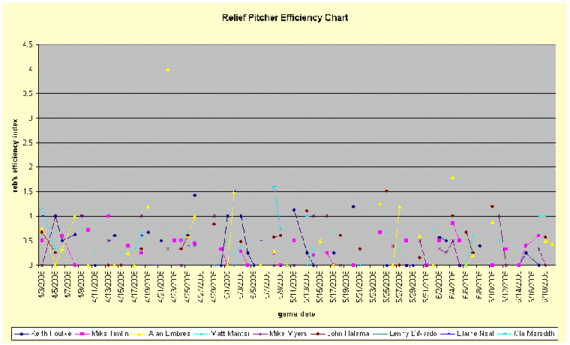
Perfection = 0. Anything over .500 is not so hot. One and above are "disgustingly awful" as I described in my much less sophisticated chart two weeks ago. Below is a chart of the PEI scores for sox relievers in each outing. Note that Alan Embree achieved an impressive PEI score of 4 on 4/22.
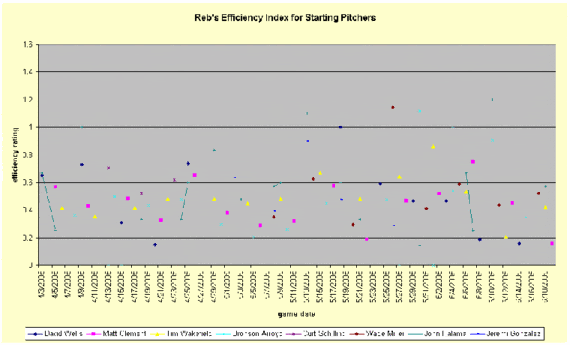
Yeah, I don't expect anyone to make much sense out of that. And here's the chart for starting pitchers:

These charts aren't exactly what I wanted, but for some reason they won't connect the dots when there is a break in data, and of course these guys don't pitch every day, do they? So that's a little bug I have to figure out. I'm kindof an amateur when it comes to excel... Let's just say my job doesn't call for spreadsheets too often. Frankly, you people are lucky I even figured out how to post these.
I plan to make individual charts for each pitcher... those will be easier to look at. I think I will date them improperly so we can keep them in a seperate archive. So when you suddenly see an archive for April, that will be it. In the meantime, I thought you might like to know the average PEI's of everyone who has thrown a pitch for the sox this year. See the next post.
